System KPI-aided Diagnosis
Availability
This feature is available since openGauss 1.0.0.
Introduction
KPIs are views of key performance indicators for kernel components or the entire system. Based on KPIs, users can learn about the real-time and historical running status of the system.
Benefits
Summarized system load diagnosis
Precise alarms for system load exceptions (overload, stall, and SLA exceptions) and precise system load profile
Summarized system time model diagnosis
Instance-level and query-level time model segmentation, diagnosing the root causes of instance and query performance problems
Query performance diagnosis
Database-level query summary, including top SQL, SQL CPU usage, I/O consumption, execution plan, and excessive hard parsing
Diagnosis of disk I/O, index, and buffer performance problems
Diagnosis of connection and thread pool problems
Diagnosis of checkpoint and redo (RTO) performance problems
Diagnosis of system I/O, LWLock, and wait performance problems
Diagnosis of over 60 modules and over 240 key operation performance problems
Function-level performance monitoring and diagnosis (by GSTRACE)
Tracing of over 50 functions at the storage and execution layers
Description
openGauss provides KPIs of 11 categories and 26 sub-categories, covering instances, files, objects, workload, communication, sessions, threads, cache I/O, locks, wait events, and clusters.
Figure 1 shows the distribution of kernel KPIs.
Figure 1 Distribution of kernel KPIs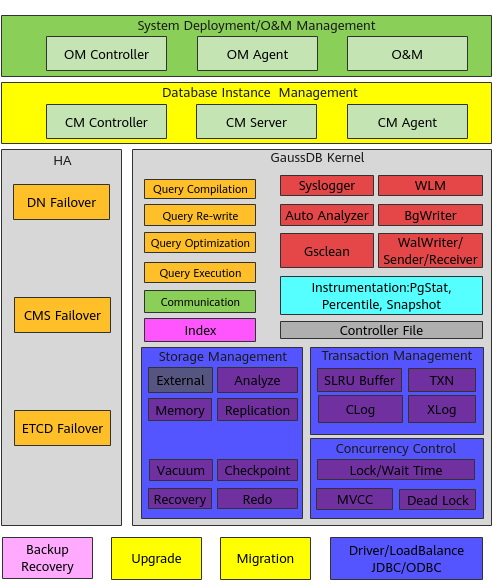
Enhancements
None.
Constraints
- Utility statements do not support normalization. Non-DML statements, such as CREATE, DROP, COPY, and VACUUM, are not supported.
- Currently, only the top-level normalized SQL statements are recorded. SQL statements in a stored procedure are not normalized, and only the SQL statements that call the stored procedure are recorded.
Dependencies
None.