Session Performance Diagnosis
Availability
This feature is available since openGauss 1.0.0.
Introduction
Session performance diagnosis targets session-level performance faults.
Benefits
- Display the latest events that consume the most resources of user sessions.
- Check the wait events that occupy the most resource-consuming SQL statements.
- Check the wait events that occupy the most resource-consuming sessions.
- Check information about the most resource-consuming users.
- Check the waiting relationship between blocked sessions.
Description
The session performance diagnosis function diagnoses performance of all active sessions in the system. As real-time collection of indicators of all active sessions has a greater impact on user load, the session snapshot technology is used to sample indicators of active sessions, and collect statistics on active sessions from the sampling. The statistics reflect the basic information, status, and resources of active sessions from the dimensions of client information, execution start time, execution end time, SQL text, wait events, and current database objects. The active session information collected based on the probability can help users diagnose which sessions consume more CPU and memory resources, which database objects are hot objects, and which SQL statements consume more key event resources in the system. In this way, users can locate faulty sessions, SQL statements, and database designs.
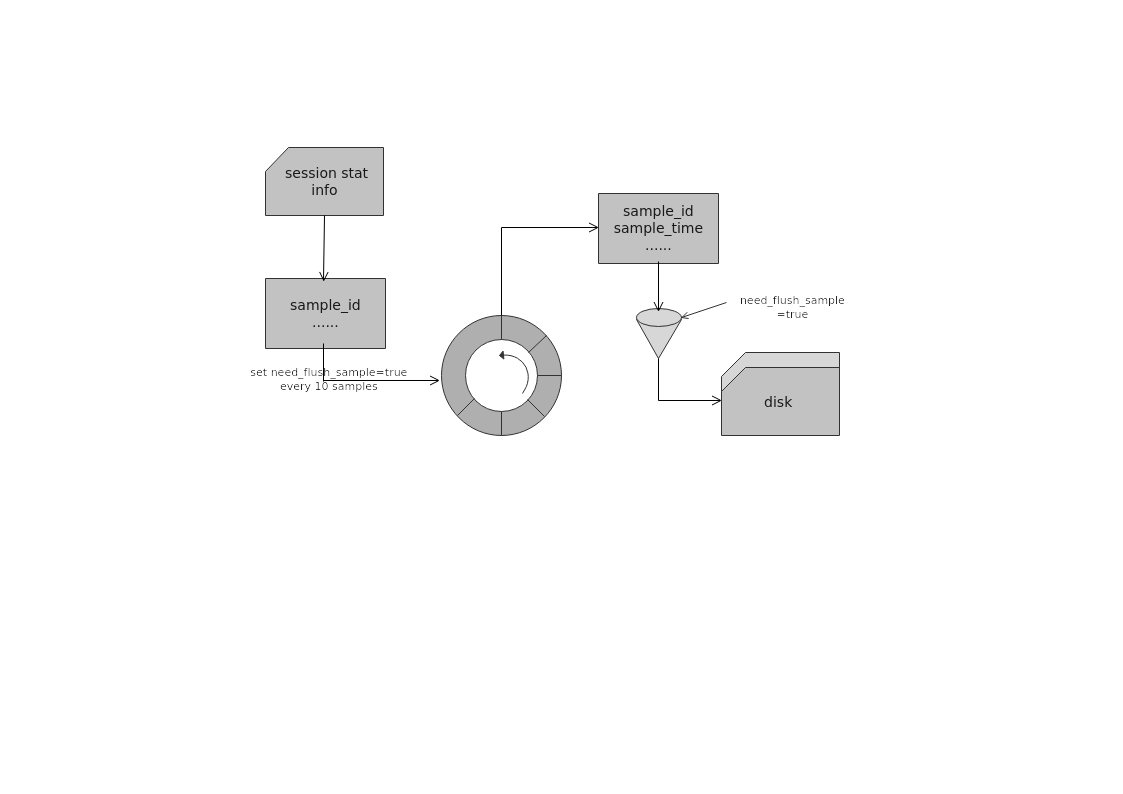
Session sampling data is classified into two levels, as shown in Figure 1.
- The first level is real-time information stored in the memory. The active session information in the latest several minutes is displayed, which has the highest precision.
- The second level is the persistent historical information stored in disk files. It displays the historical active session information in a long period of time and is sampled from the memory data. This level is suitable for long-run statistics and analysis.
Figure 1 Session performance diagnosis principle
Some application scenarios are as follows:
Check the blocking relationship between sessions.
select sessionid, block_sessionid from pg_thread_wait_status;
Sample information about blocked sessions.
select sessionid, block_sessionid from DBE_PERF.local_active_session;
Display the final blocked session.
select sessionid, block_sessionid, final_block_sessionid from DBE_PERF.local_active_session;
Check the wait event that consumes the most resources.
SELECT s.type, s.event, t.count
FROM dbe_perf.wait_events s, (
SELECT event, COUNT(*)
FROM dbe_perf.local_active_session
WHERE sample_time > now() - 5 / (24 * 60)
GROUP BY event)t WHERE s.event = t.event ORDER BY count DESC;
Check the events that consume the most session resources in the last five minutes.
SELECT sessionid, start_time, event, count
FROM (
SELECT sessionid, start_time, event, COUNT(*)
FROM dbe_perf.local_active_session
WHERE sample_time > now() - 5 / (24 * 60)
GROUP BY sessionid, start_time, event) as t ORDER BY SUM(t.count) OVER (PARTITION BY t. sessionid, start_time)DESC, t.event;
Check the events that consume the most resources in the last five minutes.
SELECT query_id, event, count
FROM (
SELECT query_id, event, COUNT(*)
FROM dbe_perf.local_active_session
WHERE sample_time > now() - 5 / (24 * 60)
GROUP BY query_id, event) t ORDER BY SUM(t.count) OVER (PARTITION BY t.query_id ) DESC, t.event DESC;
Enhancements
None
Constraints
None
Dependencies
None