Enhanced Features
Data Partitioning
Data partitioning is a general function for most database products. In the openGauss, data is partitioned horizontally with a user-specified policy. This operation splits a table into multiple partitions that are not overlapped.
openGauss supports: 1. The range partitioning function divides a record, which is to be inserted into a table, into multiple ranges using one or more columns and create a partition for each range to store data. Partition ranges do not overlap. 2. The list partitioning function divides the key values in the records to be inserted into a table into multiple lists (the lists do not overlap in different partitions) based on a column of the table, and then creates a partition for each list to store the corresponding data. 3. The hash partitioning function uses the internal hash algorithm to divide records to be inserted into a table into partitions based on a column of the table. If you specify the PARTITION parameter in the CREATE TABLE statement, data in the table will be partitioned.
For example, Table 1 uses an xDR scenario to describe the benefits provided after data is partitioned based on time fragments.
Table 1 Partitioning benefits
Data partitioning provides the following benefits:
Improve manageability: Tables and indexes are divided into smaller and more manageable units. In this way, data management can be performed by partitions. Database administrators will perform maintenance in the designated area of the table.
Improve deleting performance: Delete an entire partition rather than delete data by row, which is very efficient.
The DROP TABLE syntax can be used to delete both ordinary tables and partitioned tables.
Improve query performance: Restrict the volume of data to be checked or operated to facilitate query.
With partition pruning, also known as partition elimination, openGauss filters out unexpected partitions and scans only the remaining partitions. Partition pruning greatly improves query performance.
Partition-wise Join: Partitioning can also improve the performance of multi-table joins by using a technique known as partition-wise join. Partition-wise joins can be applied when two tables are joined and at least one of these tables is partitioned using a join key. Partition-wise joins break a large join into smaller joins of “identical” datasets. “Identical” here is defined as covering the same set of partitioning key values on both sides of the join, ensuring that only a join of these 'identical' datasets will produce a result without considering other datasets. List partitions and hash partitions are not supported currently.
Vectorized Executor and Hybrid Row-Column Storage Engine
In a wide table containing a huge amount of data, a query usually only involves certain columns. In this case, the query performance of the row-store engine is poor. For example, a single table containing the data of a meteorological agency has 200 to 800 columns. Among these columns, only ten of them are frequently accessed. In this case, a vectorized executor and column-store engine can significantly improve performance by saving storage space.
Vectorized executor
Figure 1 shows a standard iterator module. Control flow travels in the downlink direction (shown as solid lines in the following figure) and data flow in the uplink direction (shown as dotted lines in the following figure). The upper-layer node invokes the lower-layer node to request data and the lower-layer node only returns one tuple to the upper-layer node at a time.
By contrast, the vectorized executor returns a batch of tuples at a time, which significantly improves performance using column store.
.png)
Hybrid Row-Column Storage Engine
openGauss supports both the row-store and column-store models. Users can choose a row-store or column-store table based on their needs.
Generally, column store is applicable to OLAP service scenarios (The range statistics query and batch import operations are frequent. The update, deletion, point query, and point insertion operations are infrequent. The table contains many columns, that is, a wide table. Only a few columns are involved in the query.) The row store is applicable to OLTP service scenarios (The query, insert, delete, and update operations are frequent. The range statistics query and batch import operations are infrequent. The number of table columns is small. Most columns are queried.)
The hybrid row-column storage engine achieves higher data compression ratio (column store), index performance (column store), and point update and point query (row store) performance, as shown in Figure 2.
Figure 2 Hybrid row-column storage engine
The restrictions of the column store engine are as follows:
For DDL statements, only CREATE TABLE, DROP TABLE, and TRUNCATE TABLE are supported.
Partition management using DDL statements (such as ADD PARTITION, DROP PARTITION,** MERGE PARTITION**,** and EXCHANGE**) is supported.
The CREATE TABLE LIKE statement is supported.
The ALTER TABLE statement is partially supported.
Other DDL statements are not supported.
For DML statements, UPDATE, COPY, BULKLOAD, and DELETE are supported.
Triggers and primary foreign keys are not supported.
Psort index, B-tree index, and GIN index are supported. For details, see “SQL Reference > SQL Syntax > CREATE INDEX” in the Developer Guide.
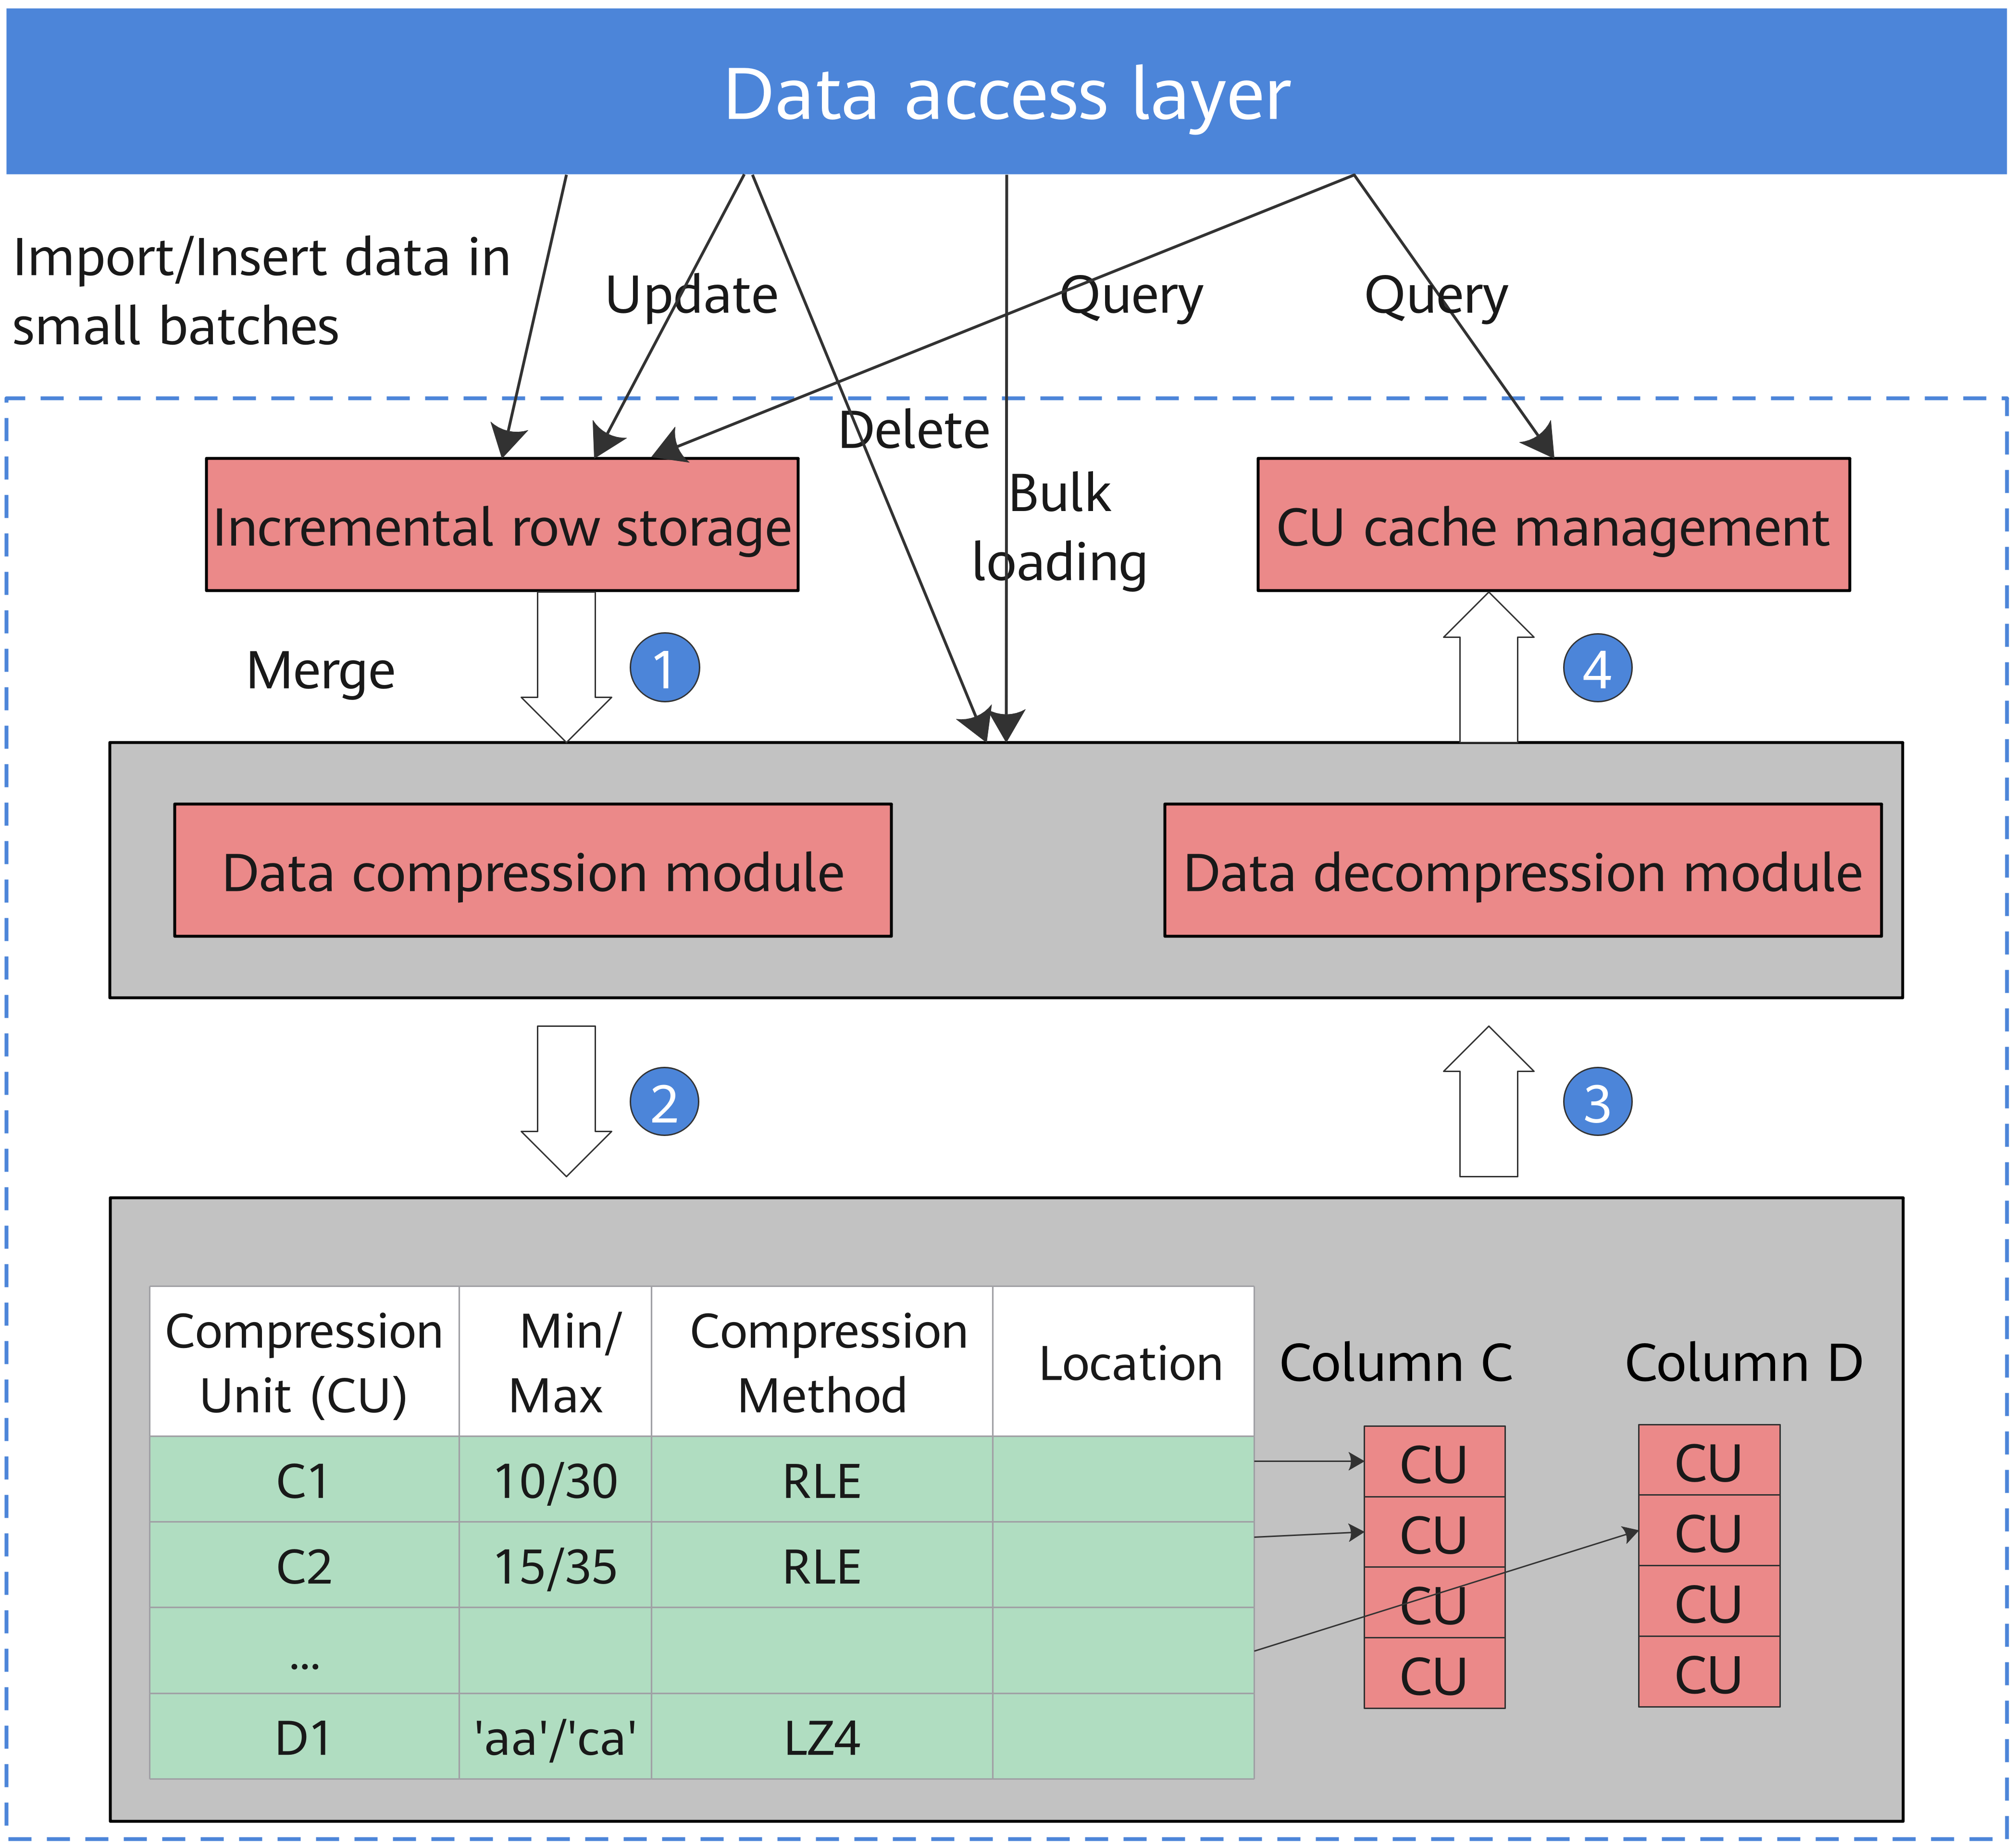
Data compression in column store
Inactive and earlier data can be compressed to free up space, reducing procurement and O&M costs.
In openGauss, data can be compressed using delta encoding, dictionary coder, RLE, LZ4, and ZLIB algorithms. The system automatically selects a compression algorithm based on data characteristics. The average compression ratio is 7:1. Compressed data can be directly accessed and is transparent to services. This greatly reduces the preparation time before accessing historical data.
High Availability (HA) Transaction Processing
openGauss manages transactions and guarantees the ACID properties.
openGauss provides a primary/standby HA mechanism to reduce the service interruption time when the primary node is faulty. It protects key user programs and continuously provides external services, minimizing the impact of hardware, software, and human faults on services to ensure service continuity.
Fault recovery
Node faults can be recovered and the ACID properties still exist after the recovery. openGauss ensures zero data loss after a node is recovered from a fault or restarted.
Transaction management
- Support transaction blocks. The Start Transaction command can be used to start a transaction block explicitly.
- Support single-statement transactions. If explicit startup is not performed, a single statement is processed as a transaction.
High Concurrency and High Performance
openGauss supports 10,000 concurrent connections through server thread pools. It supports thread nucleophilicity and millions of tpmC using the NUMA-based kernel data structure, manages TB-level large memory buffers through efficient hot and cold data elimination, achieves multi-version access without read/write blocks using CSN-based snapshots, and avoids performance fluctuation caused by full-page writes using incremental checkpoints.
SQL Self-Diagnosis
To locate performance issues of a query, you can use EXPLAIN PERFORMANCE to query its execution plan. However, this method produces many logs, requires to modify service logic, and depends on expertise to locate problems. SQL self-diagnosis enables users to locate performance issues more efficiently.
Before running a job, set the GUC parameters resource_track_level and resource_track_cost, and obtain the possible performance issues after job execution by checking the related system view. The system view describes the possible causes of performance issues. To optimize low-performance jobs, see “**Performance Tuning **> SQL Tuning > Typical SQL Optimization Methods > Optimizing SQL Self-Diagnosis” in the Developer Guide.
SQL self-diagnosis helps users locate and optimize performance issues without affecting operations or modifying service logic.
Equality Query in a Fully-encrypted Database
With the rapid growth and maturity of cloud infrastructure, cloud database services are emerging one after another. Cloud databases have become an important growth point of database services in the future. Most traditional database service vendors are accelerating the provision of high-quality cloud database services. Regardless of offline or cloud database services, the core task of databases is to help users store and manage data and ensure that data is not lost, privacy is not disclosed, data is not tampered with, and services are not interrupted in complex and diversified environments. This requires a specific multi-level security defense mechanism of the database to defend against malicious attacks from multiple aspects. Mature security technologies are used to build a multi-level database security defense system, ensuring database security in applications. Therefore, to better protect sensitive and privacy data, especially for cloud database services, a systematic solution that can completely protect data privacy throughout the entire lifecycle on the server is urgently needed. This solution is referred to as an encrypted database solution.
Overall encrypted database solution
The encrypted equality query belongs to the first phase of the encrypted database solution, but complies with the overall architecture of the encrypted database. Figure 3 shows the overall architecture of the encrypted database. The complete form of the encrypted database includes the cryptology solution and the combination solution of software and hardware.
Figure 3 Overall encrypted database architecture
-0.png)
Only the software part of the overall encrypted database architecture needs to be integrated because only the software part is involved in the encrypted equality query. Figure 4 shows the overall implementation solution.
Figure 4 Overall encrypted equality query solution
-1.png)
In the overall process, data is encrypted on the client and sent to the openGauss server in ciphertext. That is, an encryption and decryption module needs to be constructed on the client. The encryption and decryption module depends on the key management module which generates the root key (RK) and client master key (CMK). With the CMK, a column encryption key (CEK) can be defined through the SQL syntax. A CMK is encrypted by an RK and then saved in the key store file (KSF). Both CMK and RK are managed by the KeyTool. The CMK uses the symmetric encryption algorithm AES256 to encrypt a CEK and then stores it on the server.
The client uses the symmetric encryption algorithms AES (including AES128 and AES256) to encrypt data based on the generated CEK. The encrypted data is stored on the database server. After the ciphertext calculation, the server returns the ciphertext result set, and the client decrypts the data to obtain the final result.
Users can define encryption attributes for data based on service requirements. Data that does not need to be encrypted is sent to the server in the original plaintext format. After a query task is initiated, the client needs to parse the current query. If the query statement involves encrypted columns, the parameters related to encrypted columns need to be encrypted. (The encryption must be deterministic encryption. Otherwise, the corresponding query cannot be supported.) If no encrypted column is involved in the query statement, the query statement is directly sent to the server, and no additional operation is required.
On the database server, data in the encrypted column is always stored in ciphertext, and the entire query is also implemented in ciphertext. In the first phase of the solution, deterministic encryption is required so that the same plaintext data can obtain the same ciphertext. In this way, equality calculation is supported.
Encrypted database flowchart
Figure 5 Encrypted database flowchart

In the flowchart, the encrypted database allows the client to encrypt sensitive data within the client application. During the query period, the entire service data flow exists in the form of ciphertext during data processing. It has the following advantages:
- Protects data privacy and security throughout the lifecycle on the cloud.
- Resolves trust issues by making the public cloud, consumer cloud, and development users keep their own keys.
- Enables partners to better comply with personal privacy protection laws and regulations with the help of the full encryption capability.
Usage scenarios
Hybrid cloud scenario: The database client and server are deployed on the user's private network, and the client uses Huawei management and control interface.
Public cloud scenario: The database client is on user's local PC, and the database server is on HUAWEI CLOUD.
Public cloud services: Both the database client and server are deployed on HUAWEI CLOUD.
Memory Table
With memory tables, all data access is lock-free and concurrent, optimizing data processing and meeting real-time requirements.
Primary/Standby Deployment
The primary/standby deployment mode supports synchronous and asynchronous replication. Applications are deployed based on service scenarios. For synchronous replication, one primary node and two standby nodes are deployed. This ensures reliability but affects performance. For asynchronous replication, one primary node and one standby node are deployed. This has little impact on performance, but data may be lost when exceptions occur. openGauss supports automatic recovery of damaged pages. When a page on the primary node is damaged, the damaged page can be automatically recovered on the standby node. Besides, openGauss supports concurrent log recovery on the standby node to minimize the service unavailability time when the primary node is down.
In addition, in primary/standby deployment mode, if the read function of the standby node is enabled, the standby node supports read operations instead of write operations (such as table creation, data insertion, and data deletion), reducing the pressure on the primary node.
AI Capabilities
Automatic parameter optimization
In database scenarios, the optimal parameter value combinations of different types of jobs are different from each other. To achieve better running performance, users want to quickly optimize database parameters. People learning to adjust parameters is not cost-effective, real-time or widely available. Automatic adjustment of database parameters through machine learning helps improve the parameter adjustment efficiency and reduce the cost of parameter adjustment.
Automatic parameter optimization can be performed in online or offline mode, and supports multiple algorithms, including reinforcement learning and global search.
When the model is in the training phase, a new parameter value combination is obtained by using the reinforcement learning and heuristic algorithm based on an input database parameter value (including a current parameter value and a current performance parameter value of the database). The parameter adjustment of the database is obtained by mixing output results of two parts: reinforcement learning and heuristic algorithm. The output of the model is de-normalized to obtain a new parameter value. The new value is inserted into the database and the testing job is run to obtain the database performance under the current value combination, such as the execution duration and throughput. Finally, the performance is fed back to the learning model and iterated.
When the model is in the testing phase, the parameter values of the current database are used as the input, including the current parameter value and current performance parameter value of the database. The optimal parameter adjustment solution in the current situation is obtained through the model.
When the model is in recommendation mode, second-level parameter recommendation is directly performed based on the current workload characteristics of the user.
Slow SQL discovery
In the actual production environment, users usually hope that jobs can be successfully executed in the fastest way. However, because the complexity of statements varies, execution times are different. Users want to identify the statements that may take a long time before execution, and execute them separately to prevent long-time locks from affecting the execution of other statements. In addition, users hope that the advance identification function does not occupy the original resources of the user database or affect the original response time.
The slow SQL diagnosis feature uses machine learning algorithms to construct an AI framework, parses the semantic structures of the statements, and qualitatively or quantitatively predicts the execution time of unknown statements based on the parsing results to meet users' requirements for identifying slow SQL statements in advance.
Slow SQL diagnosis has two main phases: training and prediction.
- Training phase: Prepare the historical SQL records of your typical services, import the historical SQL data based on the entered log address, and train the intelligent model.
- Prediction phase: After you enter the load to be predicted, the model predicts the execution time based on the historical information of each type to detect potential slow SQL statements.
Index recommendation
Single-query index recommendation and workload-level index recommendation are supported. During workload-level index recommendation, typical SQL statements are filtered based on the AI algorithm. For typical SQL statements, the optimal index is recommended and generated based on the semantic information of the statements and the statistics information of the database. Use the recommended indexes of all statements as the candidate index set, calculate the workload benefit of each candidate index, and recommend the index combination with the maximum benefit.
Time series prediction and exception detection
Time series characteristics information on the host where the database is deployed can be collected and stored. This data can be used for time series prediction, for example, storage space prediction. In addition, exceptions can be detected based on the preceding data. In this way, potential problems can be detected in advance so as to take countermeasures.
DB4AI function
DB4AI, which is compatible with the MADlib ecosystem, supports more than 70 algorithms, has performance several times higher than that of the native MADlib, and supports advanced algorithms such as XGBoost and GBDT. It implements AI tasks driven by SQL statements based on the database.
SQL execution time prediction
In scenarios such as query performance optimization and service load analysis, users often need to predict the execution time of SQL statements. Currently, the database optimizer is based on the cost model and cannot accurately predict the execution time. This feature uses AI models to predict the execution time of historical or similar queries, meeting the SQL execution time prediction requirements.
SQL execution time prediction: Coding and deep learning-based training and prediction are performed based on the collected historical performance data.
Historical data is collected by the database kernel process. The kernel process sends HTTPS requests to the Python AI engine through curl to (1) configure the machine learning model (2) send training data (3) trigger model training (4) request the training process monitoring service port (5) load the model used for training (6) and use the loaded model for prediction. The data encoding phase is completed in the database to ensure that the exported data has been anonymized. In the prediction phase, after the query plan is generated, the entire plan needs to be encoded and written into a file and then sent to the Python end. The TensorFlow computational graph on the Python end needs to be loaded only once to perform highly parallel batch prediction.
Database monitoring
During routine O&M, users need to continuously monitor the database running status. However, due to the complexity of the database, it is difficult for users to efficiently extract key data. Database self-monitoring improves O&M efficiency. You only need to pay attention to core metrics and abnormal data.
- The transaction summary information includes the transaction numbers of Submit (commit_counter) and Rollback (rollback_counter) and the transaction response time. The above transactions are accumulated values since the last restart.
- The workload SQL summary information includes the distribution of DDL, DCL, and DML in a workload and the number of SELECT, UPDATE, INSERT, and DELETE in DML. The SQL type distribution is the accumulated value since the last restart.
- The workload SUID time summary information includes the total, average, maximum, and minimum time consumptions of SELECT, UPDATE, INSERT, and DELETE operations in a workload.
- The SQL response time percentile information includes 80% and 95% of the SQL response time in the system in a past period of time.
- The Waitevents summary information contains only the event waiting information on a single node and does not contain the global aggregation information. It includes the waiting status (STATUS), I/O event (IO_EVENT), lock event (LOCK_EVENT), Lwlock event (LWLOCK_EVENT), successful waiting times, failed waiting times, total event waiting time on the node, minimum event waiting time, maximum event waiting time, and average event waiting time.
- For the SQL statements that are sent to the Parser, the Parser generates the normalized Unique SQL ID and the corresponding SQL text strings, collects statistics on the time consumed by unique SQL statements in each execution phase to analyze, optimizes SQL performance based on the time distribution, and collects statistics on the time consumed by instances and sessions in each phase to help optimize the overall system performance. It also queries the number of SQL execution times, SQL kernel response time, I/O time, CPU time, network transmission time, numbers of physical and logical reads, result sets returned by Select, scanned tuples, updated rows, deleted rows, inserted rows, and newly generated (hard) reuse (soft) plans.
Logical Log Replication
In logical replication, the primary database is called the source database, and the standby database is called the target database. The source database parses the WAL file based on the specified logical parsing rules and parses the DML operations into certain logical change information (standard SQL statements). The source database sends standard SQL statements to the target database. After receiving the SQL statements, the target database applies them to implement data synchronization. Logical replication involves only DML operations. Logical replication can implement cross-version replication, heterogeneous database replication, dual-write database replication, and table-level replication.
Automatic WDR Performance Analysis Report
Periodically and proactively analyzes run logs and WDR reports (which are automatically generated in the background and can be triggered by key indicator thresholds such as the CPU usage, memory usage, and long SQL statement proportions) and generates reports in HTML and PDF formats. The performance report can be automatically generated. The WDR generates a performance report between two different time points based on the system performance snapshot data at two different time points. The report is used to diagnose database kernel performance faults.
The WDR module consists of the following two components:
- Snapshot: The performance snapshot can be configured to collect a certain amount of performance data from the kernel at a specified interval and store the data in the user tablespace. Any snapshot can be used as a performance baseline for comparison with other snapshots.
- WDR Reporter: This tool analyzes the overall system performance based on two snapshots, calculates the changes of more specific performance indicators between the two time points, and generates summarized and detailed performance data.
Incremental Backup and Restoration (beta)
Supports full backup and incremental backup of the database, manages backup data, and views the backup status. Supports combination of incremental backups and deletion of expired backups. The database server dynamically tracks page changes, and when a relational page is updated, the page is marked for backup. The incremental backup function requires that the GUC parameter enable_cbm_tracking be enabled to allow the server to track the modification page.
Point-In-Time Recovery
Point-in-time recovery (PITR) uses basic hot backup, write-ahead logs (WALs), and archived WALs for backup and recovery. Replaying a WAL record can be stopped at any point of time, so that there is a consistent snapshot of the database at any point of time. That is, you can restore the database to the state at any time since the backup starts. During recovery, you can specify a recovery stop point with a terminal ID (TID), time, and license serial number (LSN).